As 2022/23 begins, investment performance remains volatile
The fight against inflation continues to affect investment returns as a new financial year begins. Ed Tomlinson explains.
Several months into a new financial year and superannuation investments continue to endure the same volatile performance we’ve seen throughout 2022.
In both Australia and around the world the value of investments steadily climbed in July but became fickle as we progressed through August, with that intensifying in September.
The reasons for this uncertain performance are the same ones we’ve seen all year.
Essentially, it’s higher inflation and sharply higher interest rates that’s causing the trouble. Investors continue to react to these forces by selling investments they feel could be at risk, forcing the value of shares and other assets down.
In the table below you can see how smartMonday has performed: stronger in the long term compared with negative short-term results.
smartMonday performance compared to peers to 30 September 2022 (%)
Super option
3 months p.a.
1 year
3 years p.a.
5 years p.a.
7 years p.a.
10 years p.a.
MySuper age 40*
-1.36
-8.74
2.45
6.07
7.38
n.a.
Peer group median
-0.94
-8.04
3.18
6.00
6.86
n.a.
MySuper age 45*
-1.36
-8.84
2.14
5.84
7.21
n.a
Peer group median
-0.94
-8.04
3.18
6.00
6.86
n.a.
High Growth - Index
-1.22
-9.30
3.10
6.51
7.64
9.28
Peer group median
-1.18
-9.40
3.23
6.10
6.88
9.27
Growth - Index
-1.33
-9.26
2.40
5.69
6.73
8.32
Peer group median
-0.94
-8.04
3.18
6.00
6.86
8.38
Balanced Growth - Index
-1.33
-9.15
1.75
4.81
5.73
7.16
Peer group median
-0.72
-6.52
3.25
5.35
6.08
7.42
Moderate - Index
-1.77
-10.37
-1.76
1.56
2.38
3.72
Peer group median
-0.58
-5.51
0.85
2.77
3.46
4.40
Defensive - Index
-1.51
-9.17
-2.28
0.06
0.58
1.37
Peer group median
0.11
-2.09
0.18
1.02
1.36
2.04
- Notes: Data to March 31, 2023. PA = per annum (indicating annualised returns over that period). FYTD = financial year to date. N/O = product not offered in this time period. The performance returns shown above are calculated net of investment fees and transaction costs and an allowance for tax on investment income. The returns are based on unit prices of each investment option calculated as at the end of the month. Unit prices are based on the latest available investment valuations at the time of calculation, which means they could be one or two days behind the current market indices. Past performance is not a reliable indicator of future performance.
How are long-term returns holding up?
Investment performance for the first three months of the 2022/23 financial year, indeed the past nine months altogether, have been enormously volatile. As you can see in the table above, super funds haven't been immune, and this has impacted short-term returns for many investment options.
But that’s only when you look at the returns for the past year. When you look at returns over the past five, seven and 10 years the picture is quite different. And that is what counts. Superannuation is always a long-term investment – it’s a lifelong journey to save money to fund the life you want after work.
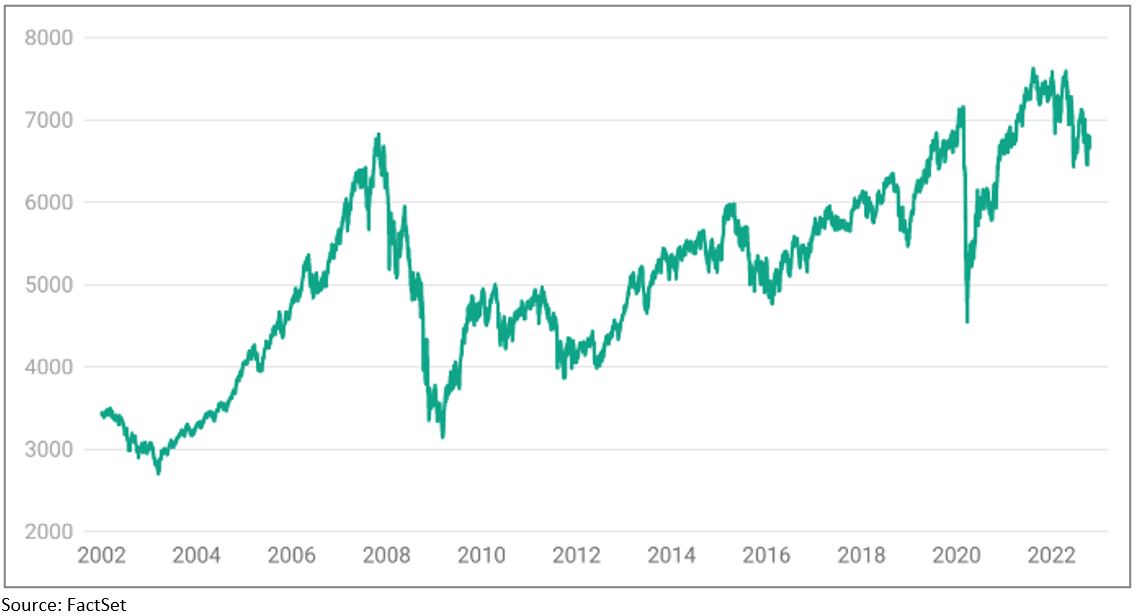
Look at the two graphs below and you can see more clearly what I mean.

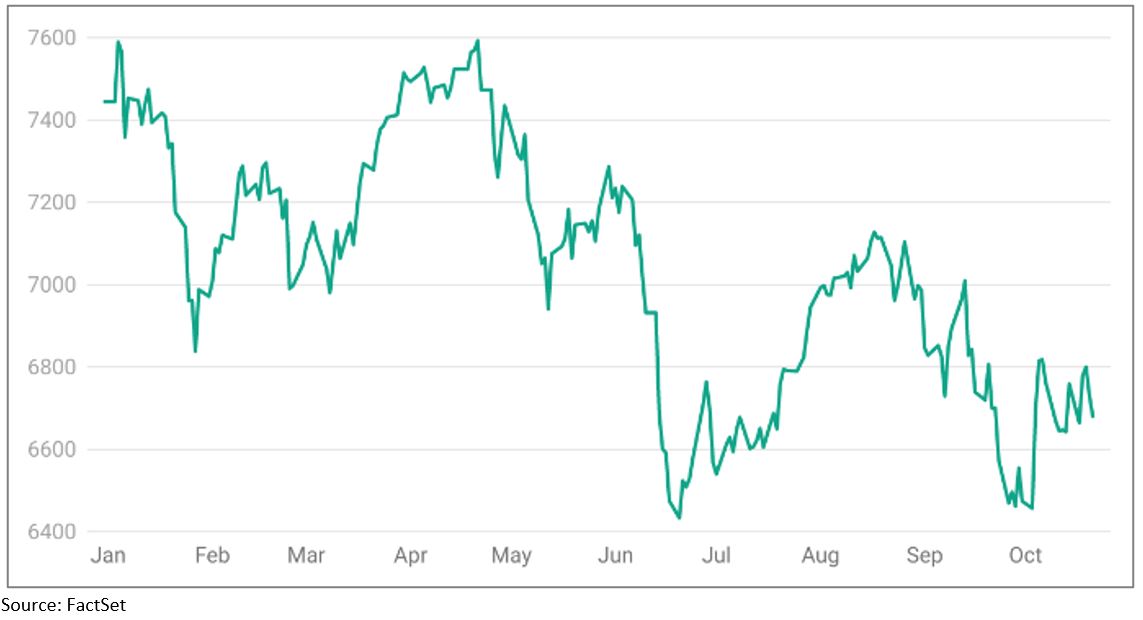

If you just focus on this year (the graph at the top), it’s a bleak picture, the market is choppy and mostly on the decline, bringing down the value of your super.
But focus on the past 20 years (the second graph) and you’re forced to step back and consider the performance of your super over the long term. You can clearly see it’s a growth story. That perspective is really important to every person who has a super account.
For those of us that manage superannuation, looking after investments every day, this is not a new story. The volatile financial conditions of this year are not surprising.
It would only be surprising if the solid period of gains we’ve had since 2009 continued. When it comes to investing there’s no way around it, some years finish with negative returns.
That’s not to be glib, it’s to be reassuring and give solid perspective to those who are currently worried. The loss members are bearing isn’t lost on us and we are proactively positioning the portfolios to balance the high uncertainty driving short-term market conditions.
Those closer to retirement have more reason for concern. Many of them are looking to depend on their superannuation soon and are watching its value decline. For them I highly recommend they seek professional advice, either through a smartMonday smartCoach or their own financial adviser.
What to expect in the short term
As inflation remains stubbornly high around the world and central banks globally continue to raise interest rates, there is a real potential for economies to fall into recession.
The short, sharp uplift in interest rates is yet to fully impact economies: there is typically a lag before it curbs consumer spending, which in turn negatively impacts jobs and investing.
All of this means the outlook for global growth has shifted negative, meaning the potential of a recession in the short-to-medium term has increased, which indicates markets could experience further volatility in the short-term.
Have questions? smartCoaches have answers
- Live chat on our website when you see the ‘let’s chat’ icon
- Phone: 1300 262 241
- Email: smartcoach@smartmonday.com.au